I decided to turn my Node-RED flow (from part 1) into a "production" application, and I knew that I wanted to use Node.js and Docker. What I didn't know, was how I was going to deploy it. I started looking at creating a dockerfile from scratch, but then I remembered PM2, a process manager for production Node.js applications. So I did the next thing that was logical to me: I googled "PM2 docker". I came across the Github page for the Official Docker Image for PM2 runtime. With this in mind, and knowing that I wanted to use Jenkins as my CI (Continuous Integration) tool, I pretty much had everything I needed to get started.


Node.js
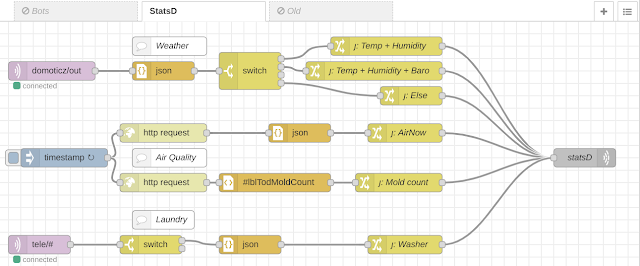
Now I don't "know" Node.js, but I had already used JavaScript a little bit for writing functions inside Node-RED. It was familiar enough to me that I felt really comfortable taking example code and StackExchange snippets and throwing something together. So... here is what I came up with (I used VSCode for this, and I called this project "darkstats" as a combination of DarkSky and StatsD)
Now if you use Node.js, you might easily be able point out how this code is flawed, or how it could be refactored (if this is the case, please let me know in the comments). Some noteworthy points about my experience:
1. I had to escape my quotes inside the JSONata expressions (\")
2. I'm using PM2 process metrics to measure total number of requests and request rate
3. If you're getting the errors "declaration or statement expected" or " ';' expected", you probably have an extra parentheses ")" in your code somewhere
4. I could not figure out how to use the Cheerio library for CSS-select for the life of me, but googleing it hard enough I was able to find a good example
5. I could have originally gone with subscribing to an RSS feed for one of my data sources, but learning how to scrape (some) webpages with CSS-select seemed to be a better use of my time
Jenkins

I found out about Jenkins a couple of years ago, from a co-worker who is a brilliant architect. I was about to get pulled into a project using it, but it turns out the documentation for the Solarwinds/Orion API was atrocious, so he ended up running with that.
I'm running Jenkins on a dedicated build server, but it can be run in docker. As far as building a docker from within a docker [insert meme here], I am not sure about that so I am sticking with a server install. I started off by creating a local git repo in the directory where the dockerfile is, having followed the instructions from the PM2 official docker. From inside the directory, I ran "git init" to create the repo, and "git add -A" to add all files in the project folder, then populated the repository URL into the Jenkins project configuration. Any time I want to update the repo, I run "git add (either filename or -A)" and then "git commit -m "comment"" for example.

I set up a build trigger, and added an alias to my .bashrc file but you should probably use bash_aliases
alias buildy='curl -u user:password http://192.168.1.107:8080/job/darkstats/build?token=youcandoit;echo "Okay. Fine."'

I have it delete my workspace before starting, as a lazy way of cleaning up files from the last build

Configured the docker build command (it uses the dockerfile in the workspace directory)

Extract the docker image into a .tar file

And clean up the docker image from the local repository

Perform post-build actions

The exec command is:
docker load -i /mnt/user/appdata/darkstats/darkstats.0.$BUILD_NUMBER.tar && docker container rm -f DarkStats ; docker container create --name DarkStats darkstats:0.$BUILD_NUMBER && docker container start DarkStats && for image in $(docker images -q darkstats); do docker image rm "$image"; done; rm /mnt/user/appdata/darkstats/*.tar
1. Loads the tar file into the local docker repository on my remote docker host
2. Removes the old container
3. Creates a new container with the new image
4. Starts the container
5. Deletes any old copies of the image (the current image will not be removed because it's running)
6. Clean up the tar file
To do the docker builds I had to enable the API on my docker host, and configure it at: Jenkins > Configure System > Docker Builder

I also had to configure the SSH server connection for artifact publishing and remote exec

Running the build, the docker image gets created successfully

And the post-actions complete (with an expected error)

The Docker container is replaced and deployed

The code is running, reporting metrics back to PM2 Keymetrics

The logs are visible as well


Well, that about wraps things up. With this workflow, it's pretty straightforward to get almost any data source into a time-series metric database for future analysis. This information can also be pulled into Grafana for even more interesting and informative dashboards. For example, I have this Unraid System Dashboard setup to monitor my Docker host. Thanks for reading!


The code is running, reporting metrics back to PM2 Keymetrics

The logs are visible as well

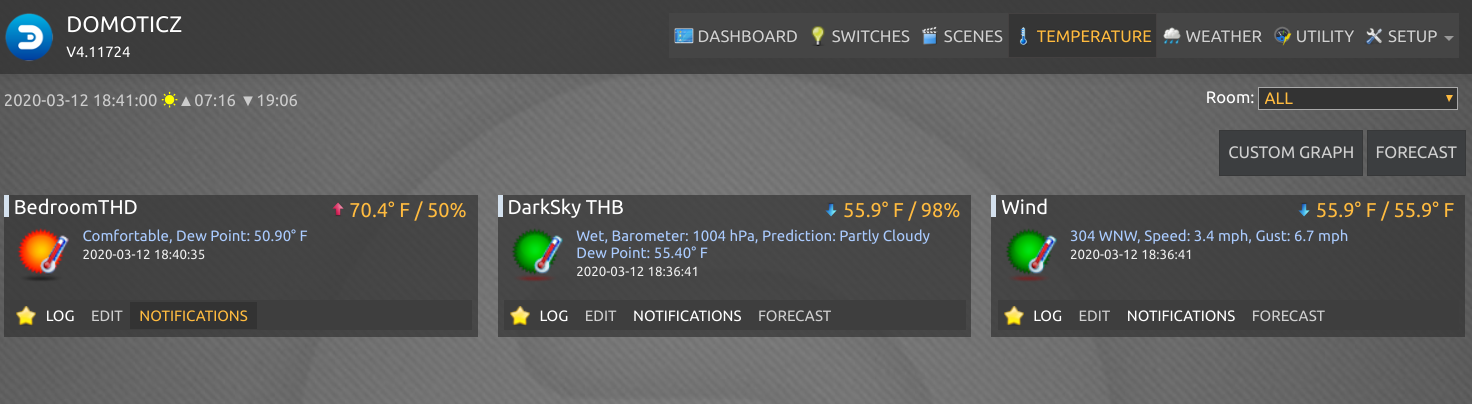
As seen in part 1, the data is visible in Graphite.

Well, that about wraps things up. With this workflow, it's pretty straightforward to get almost any data source into a time-series metric database for future analysis. This information can also be pulled into Grafana for even more interesting and informative dashboards. For example, I have this Unraid System Dashboard setup to monitor my Docker host. Thanks for reading!