When I first started using Node-RED, a visual programming tool from IBM, in 2016, I had only been using it to experiment with microcontrollers and automation. As I started exploring other open source technologies, I found myself creating actually *functional* flows and wanting to do something more, so I figured I'd give DevOps a try.
In this project I use Node-RED, with JSONata expressions, to prototype a process to extract time-series metrics data from multiple sources and send it over to StatsD/Graphite for viewing. In the second part of this project I have created a DevOps pipeline to turn the prototype into a production quality Node.js application.
In this project I use Node-RED, with JSONata expressions, to prototype a process to extract time-series metrics data from multiple sources and send it over to StatsD/Graphite for viewing. In the second part of this project I have created a DevOps pipeline to turn the prototype into a production quality Node.js application.

For part 1, I will go over the original pieces of this project and summarize how they fit together:
Domoticz, an open source home automation system
MQTT, a lightweight pub/sub message broker
Node-RED, a visual programming tool from IBM
JSONata, a query and transformation language for JSON data
JSONata, a query and transformation language for JSON data
StatsD - stats aggregation daemon created at Etsy
Graphite - time-series metrics graphing tool created at Orbitz
I am running all of these components as Docker containers on my UnRaid server (which I love for the built in update mechanism that seems to be superior to Portainer and Cockpit) :

Let us begin
1. Data sources
Domoticz
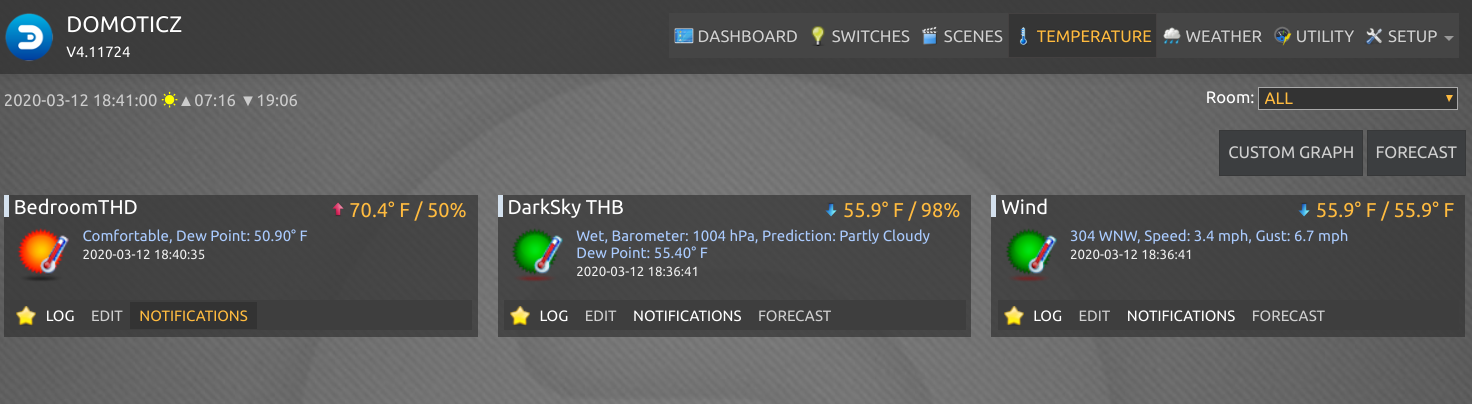
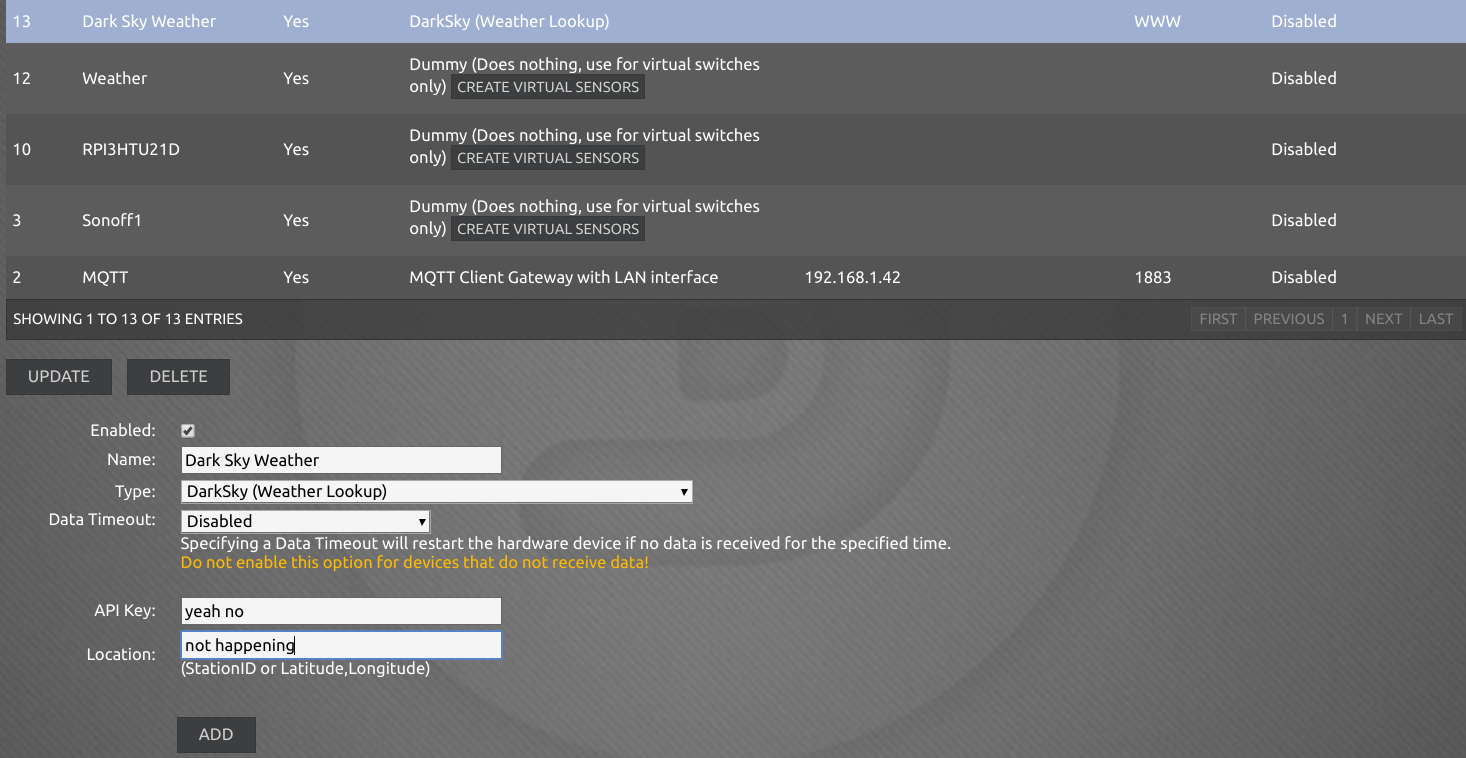
One of my data sources is Domoticz, which uses MQTT as a message broker. I have it connected to the DarkSky API. Update: sign-ups are no longer available, thanks Apple :(
Configured to connect to MQTT and publish to the domoticz/in topic

I also have a Shelly 1PM module with the Tasmota firmware flashed to it, but I had to deviate a little bit from this guide (if I recall correctly, I had to manually set it as a Shelly 2 device, then manually set the template settings from the guide).
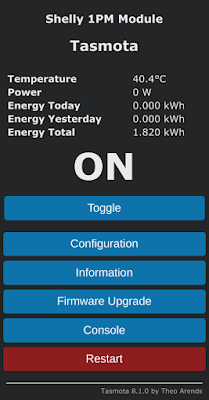
Tasmota has built in Domoticz parameters

Tasmota also has custom MQTT topic configuration which is what I use as the data source for this device, because it includes MCU temperature whereas the Domoticz topic only includes power usage

API/HTTP

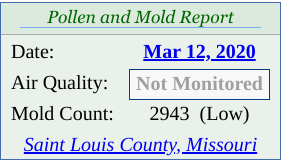
I have some other data sources that I interface with directly. I'm using the AirNow API which returns JSON output, and I'm scraping St. Louis County's Mold count iframe page with the HTML node (which uses CSS-Select), because I'm allergic to mold.
2. Process
Node-RED
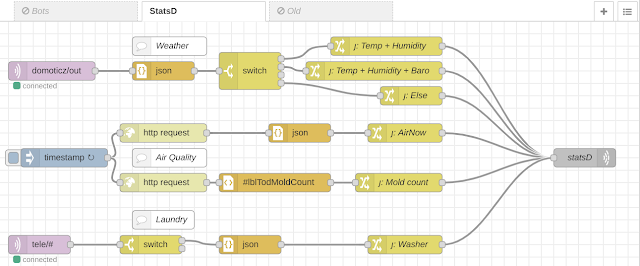
This Node-RED flow is the core piece of this project... if I did not have this tool at my disposal, I would not be interested in all of the other parts.
Here is a breakdown of my flow:
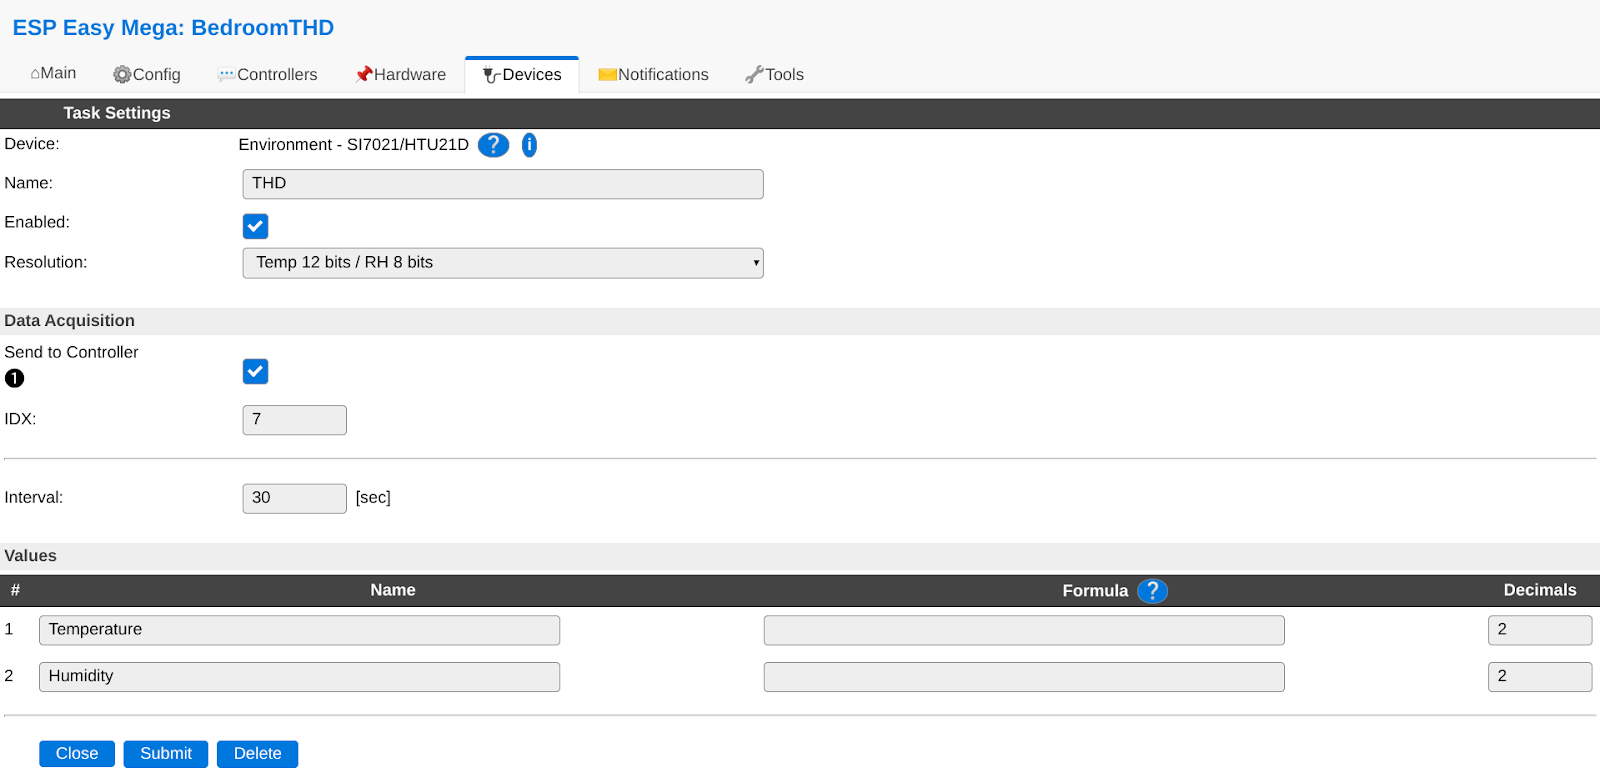
Weather (I also have a humidifier controlled by my HTU21D sensor, which I will cover another time)
1. Subscribes to MQTT topic domoticz/out
2. Converts the JSON content to an object
3. Switches the output based on payload.dtype. One data type (lights/switches) is ignored here
4. Change nodes with JSONata expressions to convert the metrics data into StatsD format (this is where the magic happens)
5. Output to StatsD via UDP (as the gauge metric type)
Air Quality
1. Timestamp nodes triggers this part of the flow every 15 minutes
2. HTTP Request nodes grab data either in JSON or or raw HTML format
3. A JSON node converts to an object for the AirNow data, and a HTML node uses CSS-select to grab the mold count
4. More change nodes with JSONata expressions
5. Output to StatsD via UDP
Laundry (I am also working on "your laundry is done" notifications, which I may cover another time)
1. Subscribes to Tasmotta MQTT telemetry topic
2. Switch node only outputs if it is sensor data being published (don't care about status)
3. JSON node converts it to an object
4. Change node with JSONata expression
5. Output to StatsD via UDP
JSONata

When I stumbled upon JSONata, and realized how powerful it is and easy to pick up, it's hard to describe how I felt. I am not a programmer and this just lowered my entry barrier to the programming world. I'll sum up how I get to this point:
1. I put a debug node at the end of my flow, outputting "complete msg object" instead of "msg.payload"


2. Copy the entire message object from the debug feed, by mousing over the right side of "object"

3. Paste the message object into the "test" tab of the JSONata expression editor, and click "format JSON"

4. Now it's a matter of building your expression, referring to the JSONata documentation. If I type "payload" as the expression, the result is the "payload" object

This is what one of my expressions looks like:
payload.name&".tmp:"&(
$number(payload.svalue1)*9/5+32
)&"|g\n"&payload.name&".hum:"&payload.svalue2&"|g\n"&payload.name&".bar:"&payload.svalue4&"|g"
With StatsD you can chain metrics together with a newline (\n). The ouput looks like this (spaces sent to StatsD are converted to underscores):
"DarkSky THB.tmp:44.78|g\nDarkSky THB.hum:51|g\nDarkSky THB.bar:1028|g"
3. Results
Graphite

And there we have it... the metrics were added to the dashboard by selecting values from paths starting with stats.gauges

I did end up making a lot of changes to the dashboard to better display the data. Overlaying certain data types in a second y-axis makes for some interesting correlations, such as rain/visibility
In part 2, I will go over the development/deployment phase, which includes the following components:
Node.js - a JavaScript runtime built on Chrome's V8 JavaScript engine.
Docker - a containerization platform
PM2 - a process manager for Node.js applications
Jenkins - an open source automation server
No comments:
Post a Comment