Thursday, August 19, 2021

Making the most of the Awair API with Node-RED, Domoticz, AWS Timestream, and Grafana


I bought an Awair Element earlier this year to keep an eye on the air quality at home, particularly in the kids room. Although the app is fantastic, I have a lot of other sensor data that I feed into Domoticz. With Domoticz I can create custom alerts or events (for example to send a Pushover notification or turn a heater/humidifier on at a given threshold). Furthermore, I have my MQTT server bridge to AWS IoT Core, and a rule that sends this data to an AWS TimeStream DB. From there I have long-term access to my data, able to visualize it with Grafana. Let’s take a quick glance at the outcome before getting started:

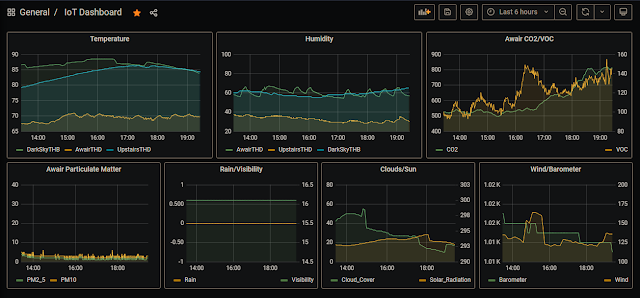
Timestream DB visualization with Grafana (including data from soon to be retired DarkSky)
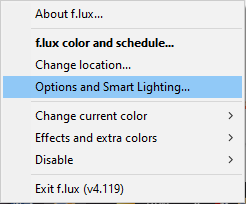
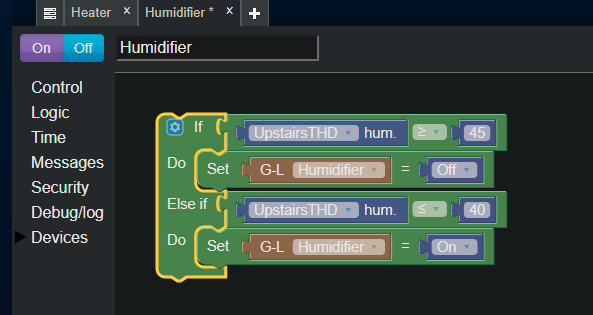

Domoticz Notifications

Domoticz Events


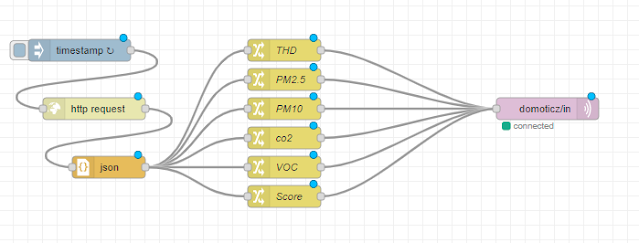
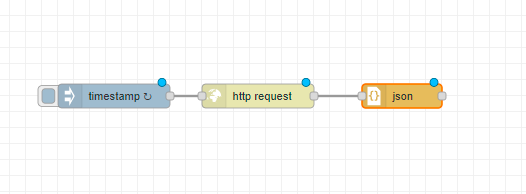
  1. First create an Inject node. The payload does not matter. Check the box “Inject once after…” and configure the interval for how often you’d like to collect the data.

  2. Next create and connect an HTTP request node, and configure it to use your Awair Element HTTP API

  3. Next, add a JSON node with the default settings

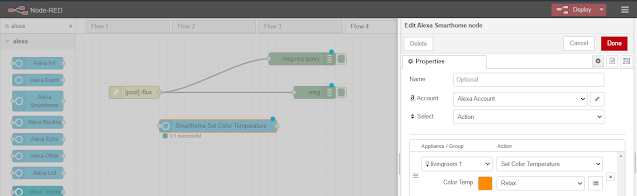
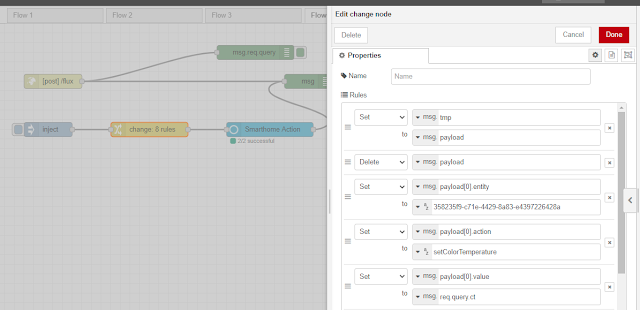
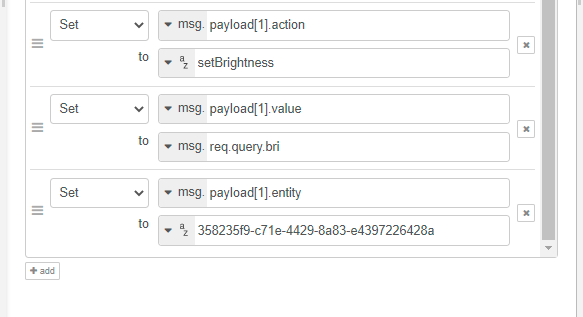
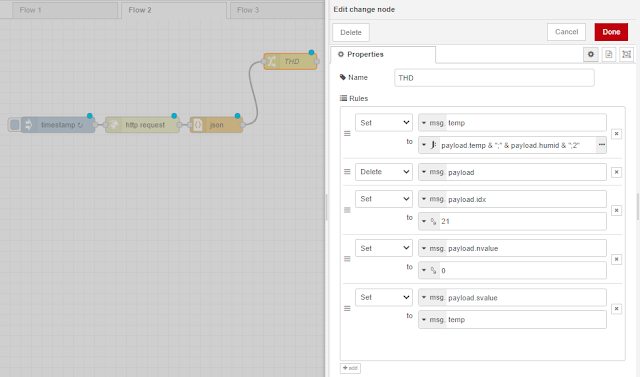
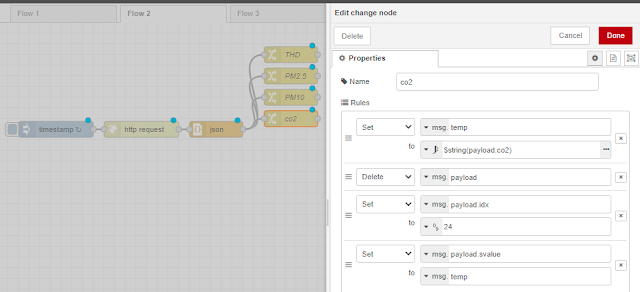
  1. Now, we add our first Change node. In Domoticz, a virtual sensor (Temp+Hum) was created, and I noted down the IDX number. Here we are using JSONata to format the payload value (into a temporary store) to what is expected by Domoticz. The payload is then cleared (so as only to have the expected payload), and is repopulated with the IDX, nvalue required by Domoticz, and the svalue with the data.

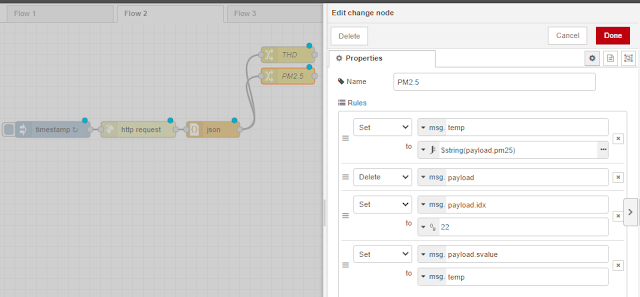
  2. Here we have the PM 2.5 sensor data. In Domoticz I created a Custom Sensor “Awair PM 2.5” and set the label as ug/m3. For the Custom Sensor type it seems that I had to use a string data type to get it to register (but parses the data as a number just fine after that point)

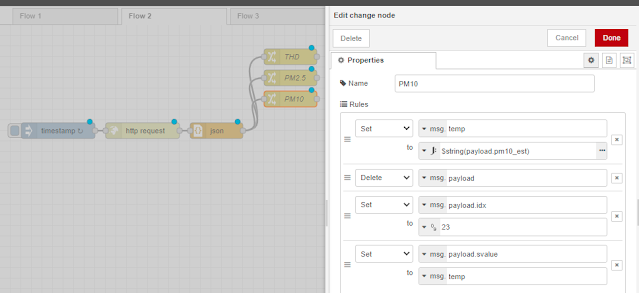
  3. Same thing for PM 10 sensor data.

  4. CO2 (ppm measurement):

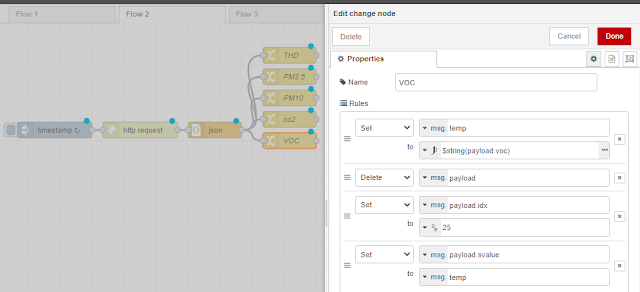
  5. VOC (ppb measurement):

  6. And last, the Awair “score” determined by mixing the sensor data:

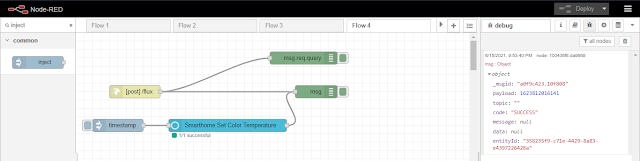
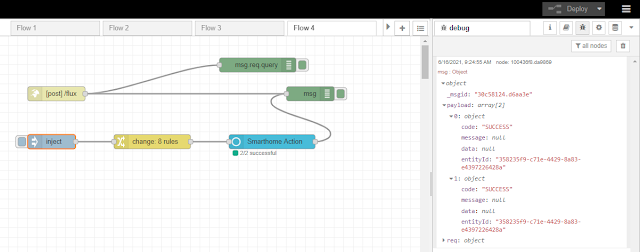
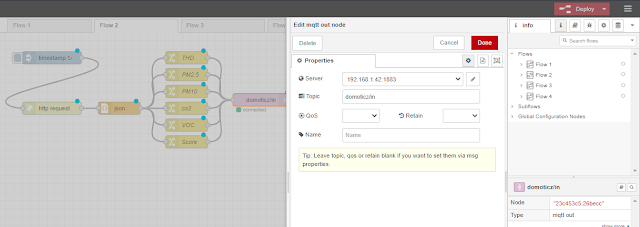
  7. Finally, create an MQTT out node, and configure it to point to the MQTT server you’re using for Domoticz. Deploy the flow, and at this point, you should have data coming into Domoticz.

  8. Temperature tab in Domoticz

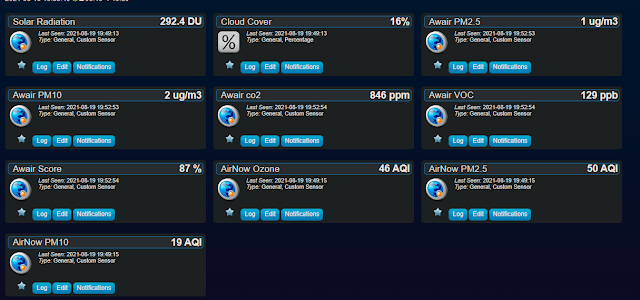
  9. On the Utility tab in Domoticz, we can see all the “Custom Sensor” data

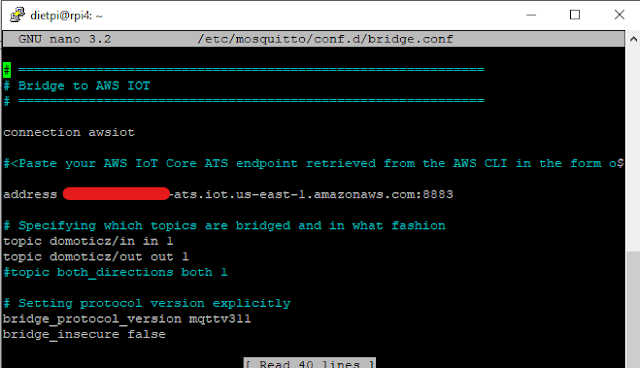
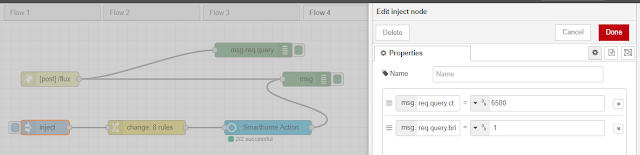
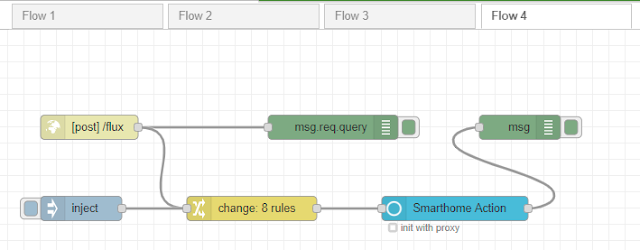
  1. For the MQTT bridge I have the domoticz/out topic going out to AWS IoT Core and domoticz/in coming back in (for some AWS Lambda functions that I have to grab even more API data such as AirNow). I highly recommend DietPi Linux if you’re using a Raspberry Pi.

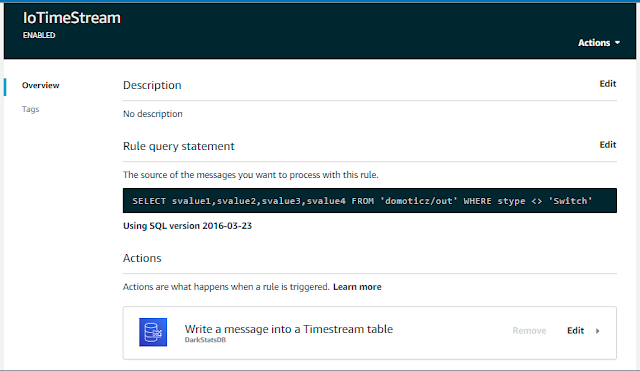
  2. In AWS IoT Core I have a rule that sends this data to a TimeStream DB (up to 200 year retention if you wanted!!!)

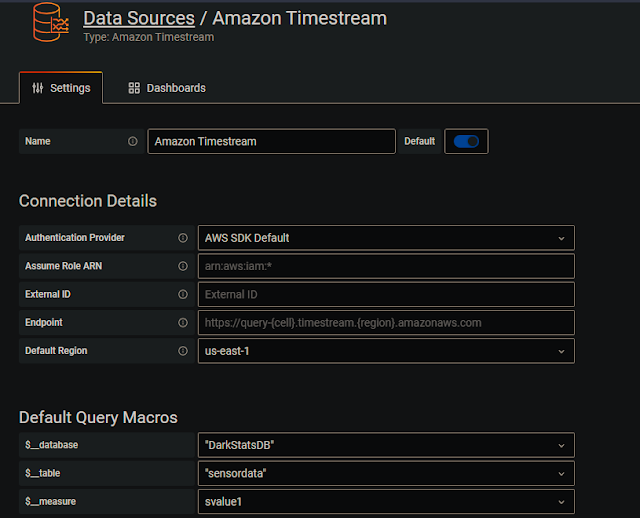
  3. For Grafana, I installed it as a Docker container in Elastic Container Services. I attached the AmazonTimeStreamReadOnlyAccess policy to the ecsInstanceRole so that it could read the Timestream DB.

  4. I then configured the Timestream plugin in Grafana. I named the DB similar to the “DarkSky” API which is End of Life soon

  5. I stumbled my way around PromQL for quite some time before figuring out how to make a proper graph. Dual Y axis is being used

  6. My AWS costs are minimal. My end of month bill is forecasted to be $1.04. I expect this to grow slowly over time as I add more and more data, but nothing to bat an eye at. 

Saturday, June 26, 2021

Resolving network latency issues with SQM


Over the past month I had been experiencing issues seemingly related to my ISP. Short periods of increased latency (lag spikes) were starting to have an effect on my sanity. After digging in several tools (a few that I knew about, a few that I didn’t before this endeavor), I was able to determine the cause of my issues (buffer bloat) and configure my router with Smart Queue Management (SQM) to resolve my latency issues.

  1. Initial discovery of issues – I have ping alerts that send me a Pushover notification on my phone when an external endpoint is unreachable. In this case I’ve been pinging CloudFlare (1.1.1.1), and I started getting notifications that pings were dropping. Normally this would tell me that my internet is down, but in this case it was telling me something different. I tried to use pathping to determine the cause of pings dropping, but I couldn’t get it to see any hops outside my network. I used SS64 to find the Linux equivalent of pathping – MTR (Matt’s traceroute). Here we can see what appears to be packet loss at my ISP’s routing partner. Although this particular issue isn’t resolved by SQM, it lead me down the path I am on now…

    C:\Users\Ray\Pictures\2.png

  1. I reached out to Equinix support, and they told me that my ISP likely has an oversubscribed port. This means that the connection is basically maxed out, and the router drops ICMP packets as “bottom of the barrel” traffic. This StackExchange answer recommends to use the tool tcping, which is a wonderful network troubleshooting tool along with tcproute (this tool can help determine what firewall a port needs to be opened on, for example). They also recommended using WinMTR, but I found that it’s not that great because it counts “no ICMP reply” hops as packet loss, and it doesn’t have alternate display modes. So basically I’ve found that it’s good to have a mix of both Windows and Linux network troubleshooting tools at one’s disposal. Using tcping to probe DNS port 53, I was able to see that none of my actual data packets to CloudFlare were dropping. I decided to leave it at this, and ping monitor quad9 (9.9.9.9) until my ISP upgrades their oversubscribed link.


  1. But now that I’ve seen what can’t be unseen, of course other issues started cropping up. I was starting to see latency and packet loss during periods of high utilization. This would manifest as lag spikes either when I was working remotely, or listening to streaming audio. Using MTR’s alternate display mode (press the D key), I was able to see some pretty wild statistics across all the hops along the route. I had my ISP come out and take a look and they replaced the modem, and the signal looked fine. With this display mode you can see with the scale, that this was a period of extreme latency. ? is packet loss and > is greater than the labeled scale.
    C:\Users\Ray\Pictures\packetloss\Screenshot 2021-06-16 124155.png

  2. Seeing that the very first hop to my router is even affected by extreme latency, I took some steps to rule it out. Pinging my router under heavy load showed latency that would seem to indicate the router is an issue. I looked up “EdgerouterX lag spikes” and I found several posts where the issue was described as “buffer bloat” and recommended to configure Smart Queue Management. I found the WaveForm buffer bloat test, and ran it on my network. It’s important to run this test directly connected to your router (with an ethernet cable) and with no heavy load on the internet connection. Bypassing my router, running the test directly from my laptop connected to the modem, I could see that the issue is not caused by my router. There are times when network congestion further down the route appears to back up and latency was much worse than this.

  3. Having done some research on SQM, I found that this has an impact on total available bandwidth. Knowing this I contacted my ISP and had them double my bandwidth to 400/20. In order for my EdgerouterX to pull bandwidth upwards of 300 Mbps, I had to configure my router to enable hwnat hardware offloading. Running a buffer bloat test, bandwidth is looking great, but still seeing latency occurring at times of congestion.
    C:\Users\Ray\Pictures\packetloss\before SQM.png

  4. I configured SQM on my router. It’s pretty simple… I did not need to use advanced settings, but it supports ECN if your other network equipment is capable.


  1. After applying SQM and running another test, I see the desired effect – lower latency with the trade off of lower bandwidth (for a single connection). I am pretty sure however that with multiple connections SQM will still be able to saturate and fully take advantage of the data connection.  Update: SQM disables hardware offloading so the full speed on my router can't be realized while using SQM. I can either downgrade my internet connection or upgrade my router to a model that can offer more throughput with SQM enabled.
    C:\Users\Ray\Pictures\packetloss\after SQM.png


The takeaway: dropped pings don’t mean dropped data packets. If you have tools such as MTR or tcping at your disposal, they can help demystify network issues. If you’re seeing latency caused by buffer bloat, you need a router that can have Smart Queue Management configured. The ISP cannot be expected to have this feature enabled on their routers as it would be a bottleneck on the network. If you’re having trouble understanding buffer bloat, check out the FAQ on the buffer bloat test page. 


Wednesday, June 16, 2021

Using f.lux with Node-RED to control Alexa lights


Back in 2017, when f.lux released the HTTP API feature, I documented my findings with it but I didn’t know what exactly to do with it. I’m not going to link to it because it’s not that good. I had wanted the ability to control Alexa powered lights with Node-RED, but I gave up my search on this for quite some time apparently. After discovering the Alexa remote control functionality with the node-red-contrib-alexa-remote2-v2 node, and writing about using the Echo Button as a Toggle Switch, I realized I could finally do something with the f.lux HTTP API. So here’s how to do it:


  1. Make a HTTP in (POST) node and give it a URL suffix.

  2. In f.lux, go to options and smart lighting

  3. On the Connected lighting tab, enter the URL specified. It will be the Node-RED URL followed by the suffix specified. http://192.168.1.11:1880/flux

  1. Create a debug node, connect the HTTP node, and click the Deploy button (remember to do this moving forward any time you want to see the results from a change) and wait for the color temperature to change in f.lux. At this time manual changes to F.lux do not get posted to the HTTP interface. Using a debug output of msg.req.query you can see the values we will need to work with.

  2. You can capture the msg.req.query output of the debug node and save it for later testing
    {"ct":"6500","bri":"1.000000"}


  1. To get the control node ready, we need to install the node. Click on Manage palette in the top-right menu.

  2. Install the node-red-contrib-alexa-remote2-v2 node.

  3. Add an Alexa Smarthome node to the flow. Configure the Alexa account for the node and pick a device or group that you want to control. To configure the Alexa account you will need to open the URL provided after deploying the node, and access sign in to generate a cookie. This cookie is stored in a text file that you will need to specify and make sure you have permissions to write to. If lights stop being controlled you may need to manually refresh the cookie by signing in to the URL again.

  4. Add an inject node to the flow to trigger the remote node. Click the inject button, and note the entityId

  1. Create a change node. 1) Store msg.payload into msg.tmp, then delete msg.payload (many things require a payload with only the data that’s expected). 2) Set msg.payload[0].action to  3) Set the value for msg.payload[0].entity (the remote node takes an array format to send multiple control commands at once) to the entityId described earlier. Set msg.payload[0].action to msg.req.query.ct.

  2. Additionally, add rules to map the brightness value.


  1. Test the sample data by configuring the inject node you created with the sample data from earlier. {"ct":"6500","bri":"1.000000"}. Be sure to set the data type as number.

  2. Delete the test action from the remote node

  3. Click the inject button to test the data

  4. Now finally,  connect the HTTP node to the change node, and Deploy the flow (hopefully) one last time. Next time f.lux changes, the specified light should change and you’ll see the output in the debug logs (I waited for it – it works). In the future f.lux may be updated to ensure API push occurs even during manual changes. We may also see “Effects and extra colors” data available through the HTTP API. If they do, I will create an updated guide to include “mood lighting” with f.lux.