I have the Ubiquiti AP-AC-Pro wireless access point... on the latest version 4.x firmware, it would reboot or lock up every month or so. I have since upgraded to the 5.x firmware, however I would like to keep an eye on the AP’s uptime just to be sure. Although I do have ping alerts where I can get a notification if a ping is dropped, there is a chance that the AP could reboot in between pings. So I set up this Node-RED flow to monitor the AP’s uptime in Domoticz, for which I can receive an alert if the uptime gets reset.

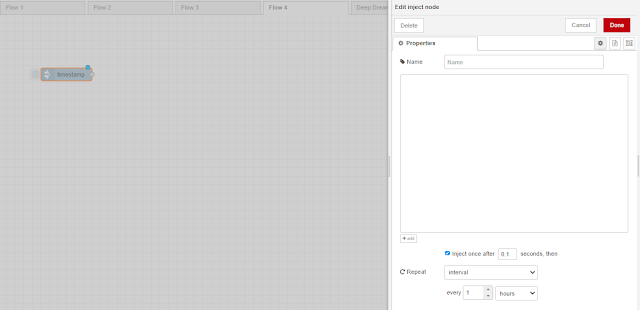
First, start with an inject node. I set the node to inject once every time the flow is deployed, and set an interval of every hour for example.
Next, we need to install an SSH node. Go to menu -> Manage Palette
On the Install tab, search for and install the bigssh node.
Add and link the bigssh node, configure credentials (be sure to use TLS for the credentials since it is supported), and configure the command as uptime.
Add and link a change node and prepare the JSONata expression. The IDX will need to be for a “custom” virtual sensor created in Domoticz.
Creating the virtual sensor in Domoticz
Get the IDX from the Devices page.


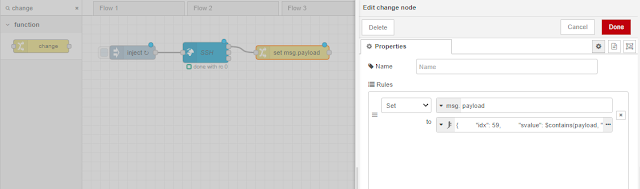


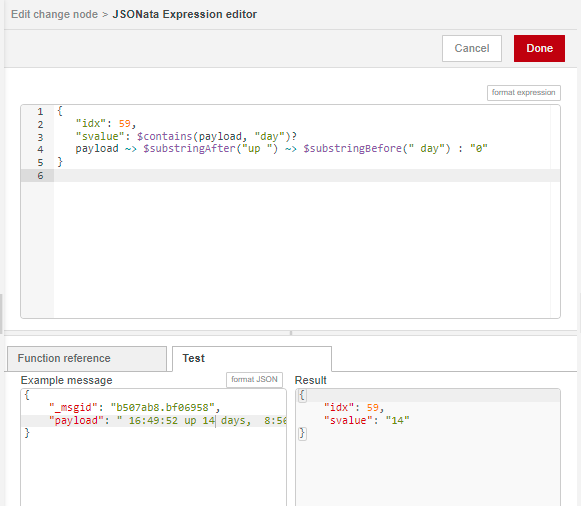
The JSONata expression creates a new object with a conditional ternary operator. If the uptime command contains the string “day”, then value for key “svalue” is set to the string between “up “ and “ day”, otherwise it is set to “0”. This JSONata expression also uses the chain operator instead of nested functions, which make it easier to read.
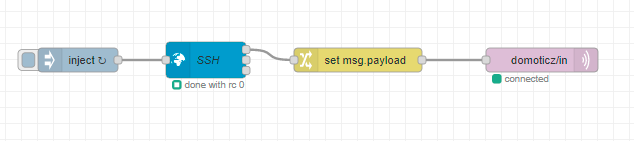
Finally, add the mqtt out node configured to use the same MQTT broker that Domoticz is using, with the topic domoticz/in, and deploy the flow.
If the SSH command has run successfully, the SSH node will show “done with rc 0”
On the Utility page in Domoticz, the virtual sensor shows the uptime.
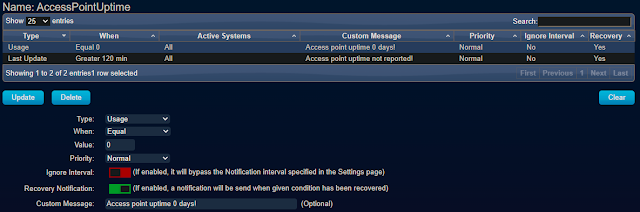
Notifications can be set if the AP uptime is 0 days or hasn’t been updated recently.
Logs will be kept which will show a history of the uptime.


This integration will allow me to easily keep an eye on my Access Point uptime to keep an eye on stability. Another integration I have in mind is monitoring CPU usage, but having investigated this, it will not be as straightforward. With the power of JSONata and Node-RED it would be easy(ish) to monitor a lot of different things… let me know in the comments if you have any ideas!
No comments:
Post a Comment