Currently I’m renting a house that happens to have a basement that leaks quite a bit in the springtime when it rains. Doing a little research, I found that this could increase the risk of exposure to radon, so I figured I would invest in some hardware to monitor this. Early last year I bought the AirThings Wave Smart Radon Detector (it also has a temperature and humidity sensor). Unfortunately this required that I buy the AirThings Hub, but later I found out it is possible to interface with the Wave via Bluetooth and a Raspberry Pi. If I had gone with this method, I am not sure if it would have stored the data in the AirThings cloud to be available with the mobile app and web dashboard.
That being said, when I first set it up, I was disappointed to find out that at the time there wasn’t a consumer API available, so I was stuck with the mobile app and web dashboard. Last month I checked and found out that the consumer API was finally made available, so I was excited to finally be able to have ownership of my sensor data. We will go over the steps to integrate the AirThings API with Domoticz after the device has been registered with the AirThings dashboard.
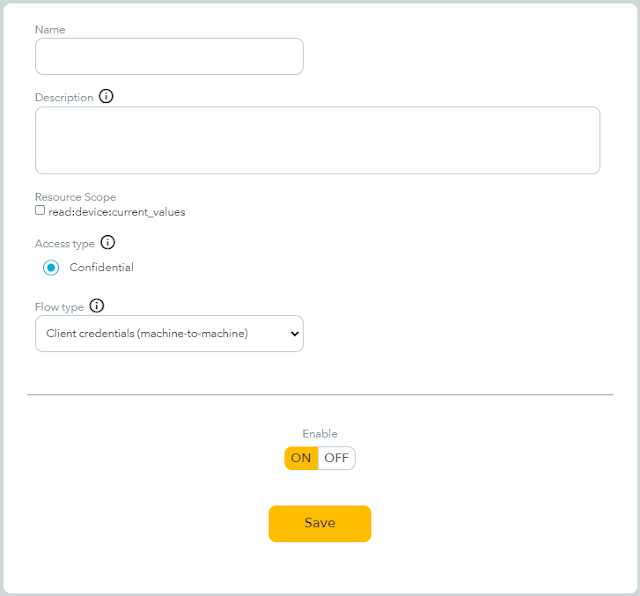
Logged into the AirThings dashboard, create an API Client. Give the client a name and description, check the box for “read:device:current_values”, make sure the “Enable” switch is toggled to “On”, and save the client configuration.
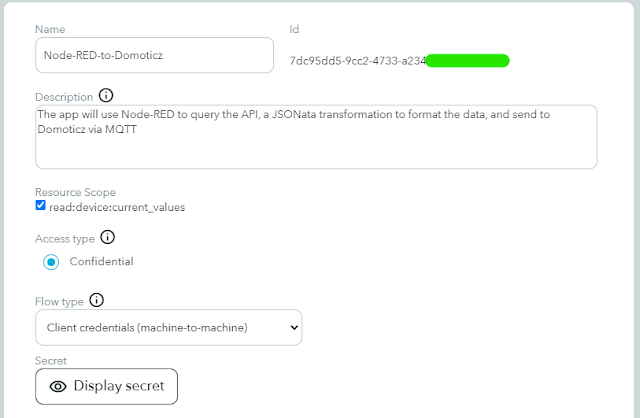
After the client has been created, an ID will be provided and a button to display the client secret. Both will be needed to integrate with the API.
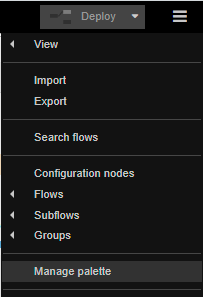
In Node-RED, go to Menu-> Manage palette
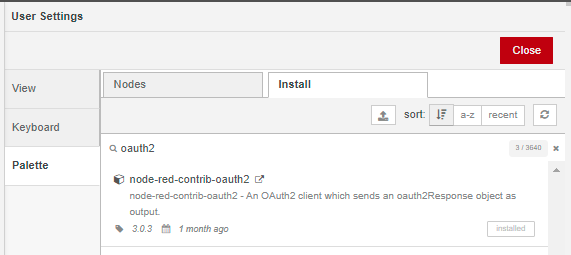
Go to the “install” tab, search for oauth2, and install the node-red-contrib-oauth2 node.
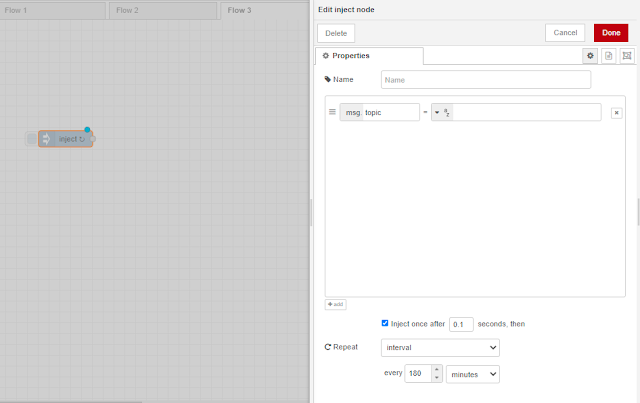
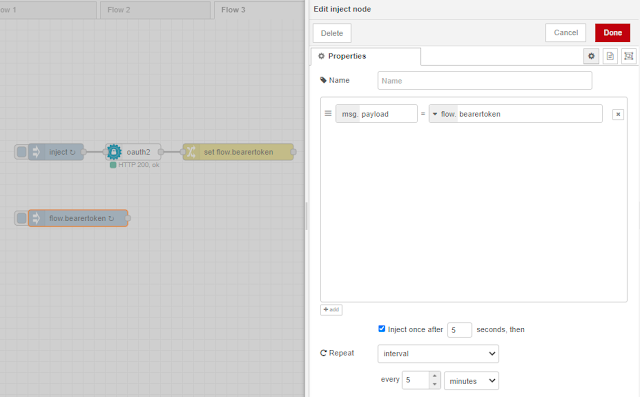
Add an inject node, set it to trigger every 3 hours (this is how long the authorization token provided by the oauth2 response is good for). Node-RED will automatically convert the interval from hours to minutes.
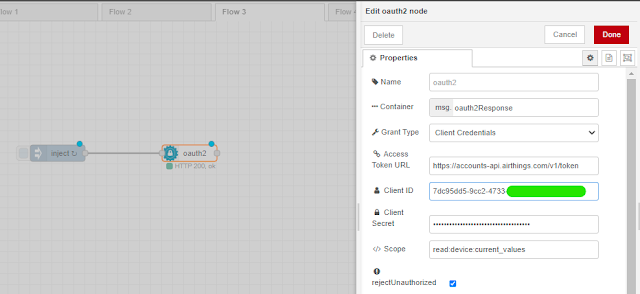
Add and link an oauth2 node. Set the Grant Type to Client Credentials. Configure the Access Token URL as https://accounts-api.airthings.com/v1/token
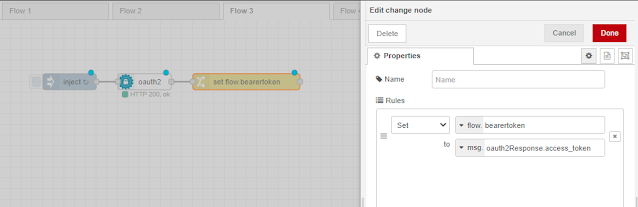
Populate the client ID and the Client Secret provided when creating the AirThings API Client. Set the scope as read:device:current_valuesAdd and link a change node. Configure the node to set flow. bearertoken to msg. oauth2Response.access_token. This stores the access token in the flow context for later (consecutive) usage.
Add another inject node to create a separate subflow. Set msg. payload to flow. bearertoken. Set to inject once after 5 seconds, instead of the default, so that the token can first be made available from the other subflow. Set the interval to every 5 minutes. The API has a rate limit of up to 120 requests per hour (up to 2 requests every minute), however I found that the data only changes every 5 minutes.
Add and link another change node. Set msg. headers to { "Authorization": "Bearer " & payload } (select JSONata expression from the drop-down). This creates a JSON object with the authorization header expected by the API (with the & symbol doing string concatenation).
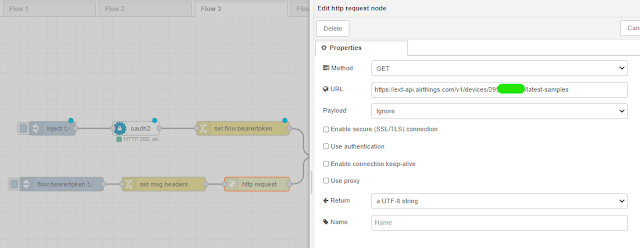
Add a http request node. Set the URL to https://ext-api.airthings.com/v1/devices. We will use this to get the serial number of the device to query.


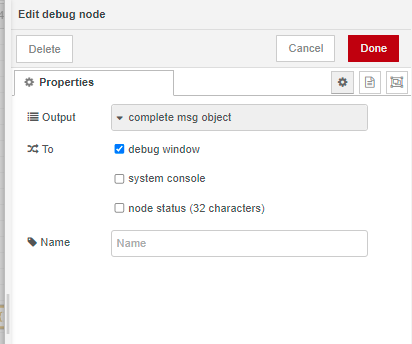
Add and link both a JSON node (to parse the response from the API) and a debug node. Deploy the flow (the button at the top right), click the button on the left side of the first inject node, and expand the console output (click the debug tab) to identify the serial number of the Wave device (not the Hub). Take note of the serial number which is displayed as id.
If having issues with the oauth2 node, configure the debug node for the complete msg object.

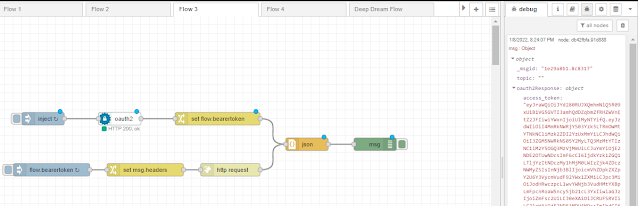
Link the first change node to the debug node, deploy the flow, and click the first inject node. The API response is displayed in the oath2Response object in the debug console. An error would be displayed here if there was an issue with the API call.
In the http request node, change the URL to https://ext-api.airthings.com/v1/devices/[serial number]/latest-samples.
Deploy the flow and click the second inject node. The API response in the payload object contains the sensor data.
Create a device in Domoticz. On the Hardware page, create a hardware of “dummy” type, and create a click the button “Create Virtual Sensor”. For the temperature and humidity sensor a sensor type of Temp+Hum would be created.
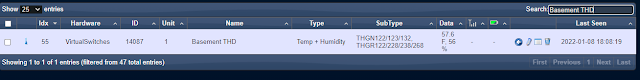
On the Devices page, take note of the IDX for the device.
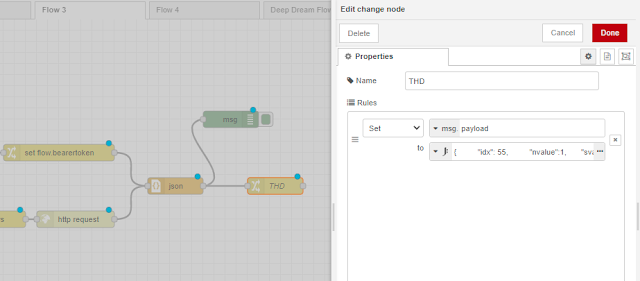
To manipulate the data for formatting to send to Domoticz, create another change node. The first one is named THD for “temperature and humidity device”. Create a JSONata expression and populate the IDX field. The expression can be pasted in with the IDX replaced.
{ "idx": 55, "nvalue":1, "svalue": payload.data.temp & ";" & payload.data.humidity & ";2" }


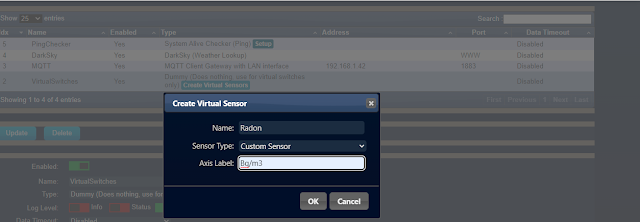
Create another virtual sensor in Domoticz for Radon. The measurement is becquerels per cubic meter. One becquerel is equal to one radioactive decay per second. For reference to the health risks previously mentioned, 1 picocurie per litre (pCI/l) is equal to 37 becquerels per cubic meter (Bq/m3).
Take note of the IDX for the Radon sensor
Add and link another change node. Populate the JSONata expression with the IDX for the Radon sensor. This JSONata expression uses the $string() function because the “custom sensor” type in Domoticz takes a string (even though it is later treated as a number in the graphs):
{ "idx": 56, "svalue": $string(payload.data.radonShortTermAvg) }
If pCi/l was desired as the form of measurement, that can be calculated in the JSONata expression such as:
{ "idx": 56, "svalue": $string(payload.data.radonShortTermAvg/37) }
If you use pCi/l just make sure the Axis Label for the virtual sensor in Domoticz is named as such.


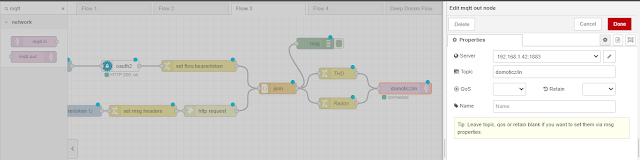
Add and configure an mqtt out node to use the same MQTT broker that Domoticz is using, with the topic domoticz/in.
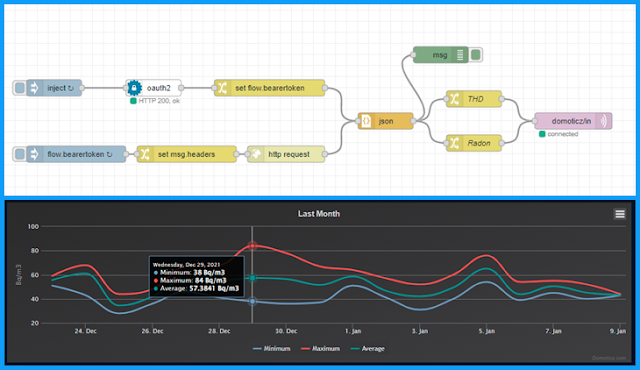
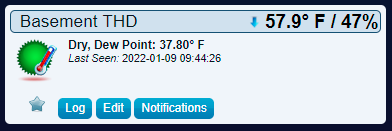
With the flow deployed and the subflows running on their respective schedules, data is now coming into Domoticz. Temperature and humidity data is visible on the Temperature tab in Domoticz.
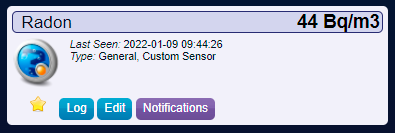
Radon sensor data is visible on the Utility tab.
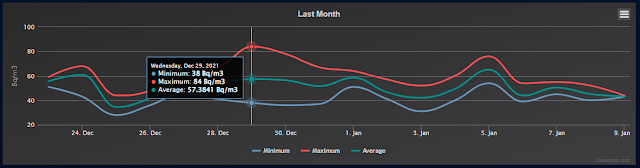
Various charts are available in Domoticz.
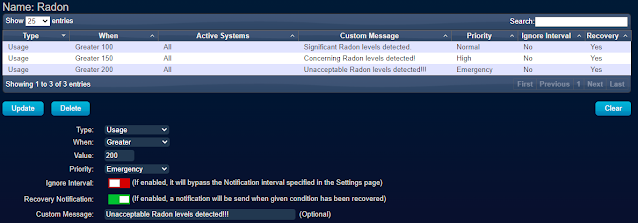
Various notifications can be set. I personally use Pushover to get notifications on my mobile device, however many other notification services can be used.
No comments:
Post a Comment