Last year I was checking out some projects on Hackster.io and I stumbled upon this post about an Arduino compatible dosimeter/radiometer based on a Geiger-Müller Tube. Somebody actually made an Arduino compatible Geiger Counter (what I am going to call it anyway), so naturally I had to add it to my collection. I previously wrote about monitoring radon (which can be more harmful than other ionizing radiation being that alpha radiation is the most destructive form of ionizing radiation when inhaled/ingested).
While it may not be as important to measure other forms of ionizing events such as cosmic radiation, it is still interesting in that it could be used to correlate soft errors in high performance computing environments (which is typically mitigated by ECC memory or radiation-hardened microcontrollers). Not to mention the fact that quantum computing could be even more affected by cosmic radiation. If you are reading this, like me you are probably simply concerned about long term health risks of exposure to radiation/ionizing events, like the risk of radon exposure. If a gamma-ray burst or a cloud of radiation were to come through my area, I would like to know about it no matter how brief. Since I have the radon sensor in the basement, I am running the Geiger Counter setup on the second floor to hopefully catch any readings from airborne or cosmic sources of ionizing events. I will go over how I set this up to report sensor values into Domoticz, but there is also a setup for Home Assistant as well.
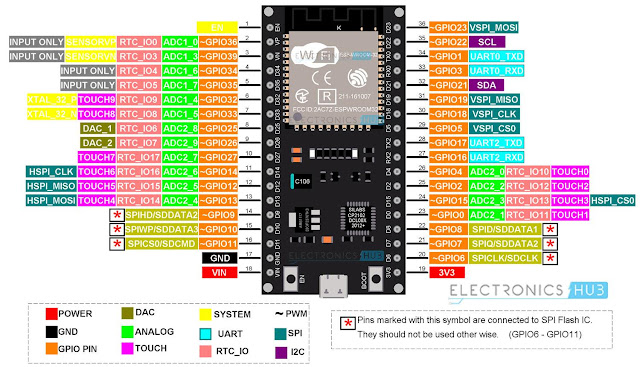
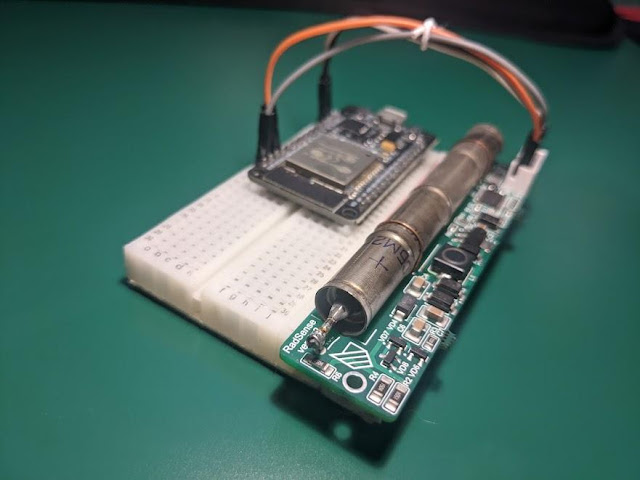
I placed an ESP32 dev board (ESP-WROOM-32 with pre-soldered pin headers) on a breadboard, connected the Radsens unit to the 3.3 and ground pins (with Dupont jumper wires), and connected the I2C pins to the D21 and D21 pins for the ESP32 dev board (refer to the schematics and the pinout for your specific dev board.
The pin numbering starts from the corner of the board.

Pinout for the ESP-WROOM 32 dev board
Supplying USB power to the dev board powers the RadSens unit. Out of the box, functionality is confirmed by the blue LED lighting up every time an ionizing event is detected. Ideally a protective case would be built for this setup; otherwise make sure it’s in a place that it won’t be disturbed or exposed to water or humans/animals (touching the Geiger–Müller tube can result in false positive detection for ionizing events).
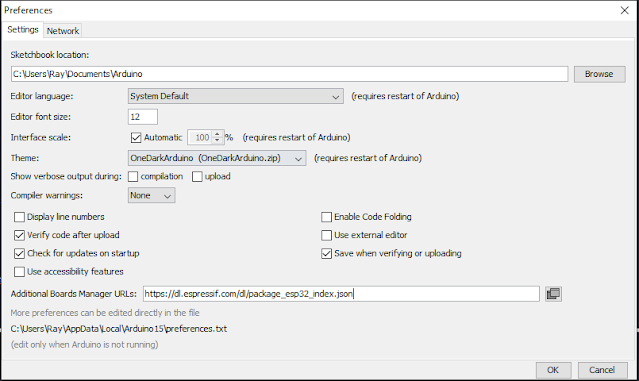
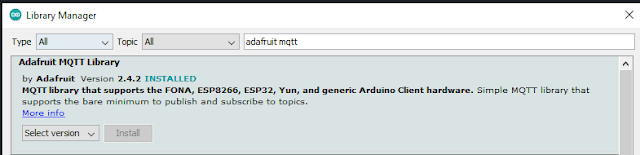
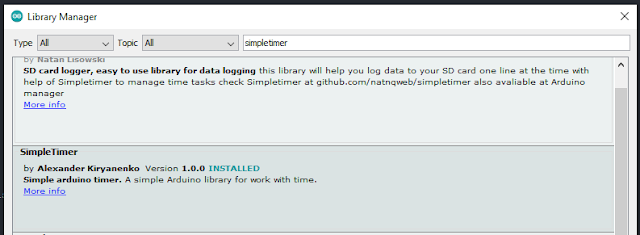
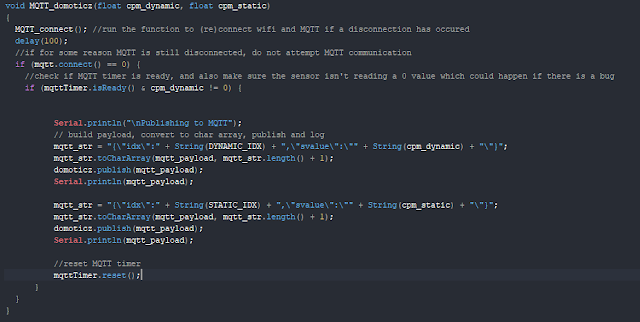
I modified the I2C_rad_test.ino Arduino sketch to add support for MQTT to transmit sensor data to Domoticz. This required installing the Adafruit MQTT library, and I also used the Simple Timer library (in case I needed to add other functionality like other sensors to read from). If you haven’t yet added ESP32 support to the Arduino IDE, navigate to File -> Preferences and paste https://dl.espressif.com/dl/package_esp32_index.json into Additional Boards Manager URLs. To install the libraries, navigate to Tools -> Manage Libraries and search/install the libraries.
Adafruit MQTT library
SimpleTimer libraryAfter connecting the dev board, be sure to set the board type and set the com port to whatever com port is detected. If your operating system did not automatically install the drivers, they can be downloaded from here.
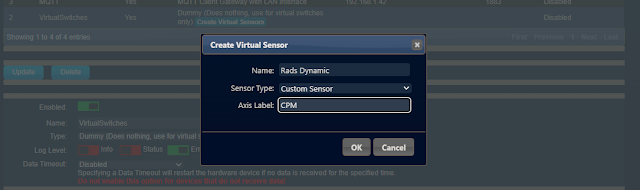
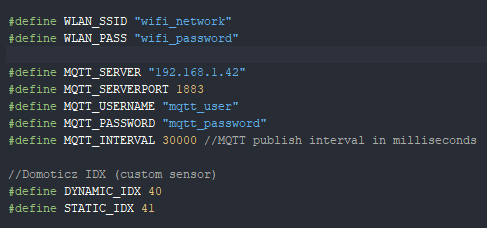
I published the sketch (and required files from the original repository) on GitHub. You’ll need to download the .zip file, extract it, and open the Radsens_to_Domoticz-main.ino file. In the #define section, you’ll need to configure wifi settings, MQTT settings, and the IDX for a “custom sensor” virtual sensor for both the dynamic and static sensor readings. The sensor readings are measured in CPM for “count per minute” (of ionizing events). I added some functions to the original sketch (as to putting the additional code in the main loop) so as to easily update if a new version of the original sketch is released for a bugfix or new features. I also commented out almost all unnecessary code which can be un-commented for troubleshooting/debugging.
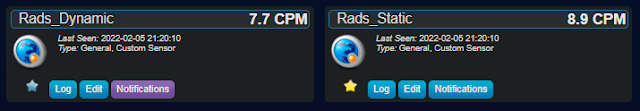
Domoticz “custom sensor” virtual sensor
Settings to configure
Function that takes sensor values, builds the payloads, and sends to Domoticz via MQTTAfter uploading the sketch, if everything has been configured properly, sensor readings will be available under the Utility tab in Domoticz.
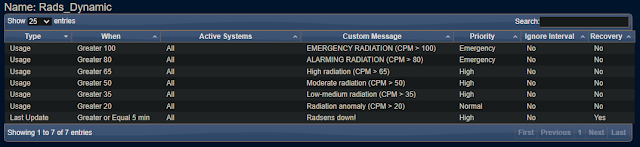
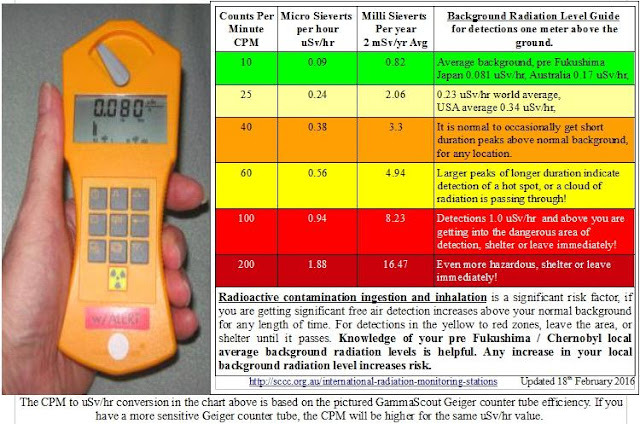
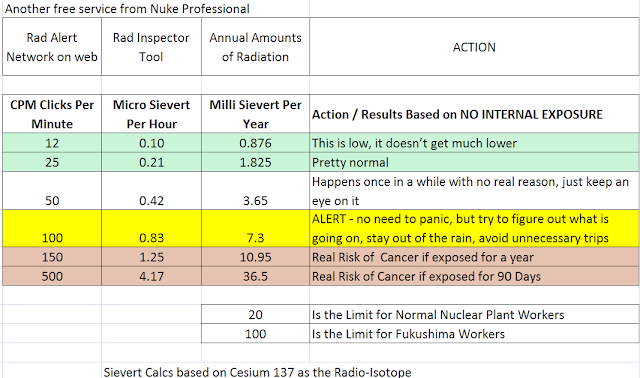
Notifications can be set for various sensor readings. I found a chart listing some levels of radiation and set some notifications. While some of the charts I found have slightly conflicting guidance (“seek shelter immediately” for > 100 CPM vs “no need to panic”), I decided to play it safe being that I don’t live near an industrial area.
Domoticz notifications
Advice to shelter immediately with CPM readings of 100 or more
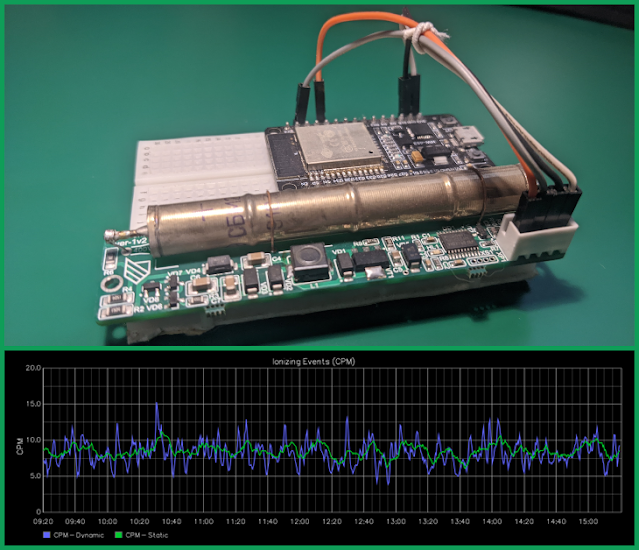
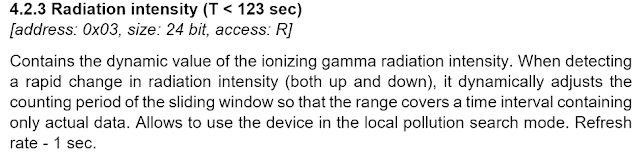
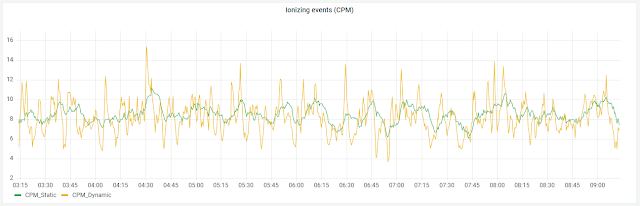
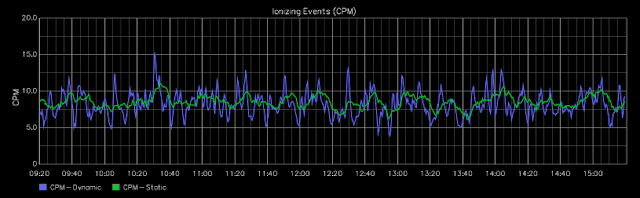
Advice not to panic, but to take caution for CPM readings of 100 or moreThe dynamic sensor readout is useful in detecting short term conditions, such as for a local pollution search (or perhaps a gamma-ray burst).
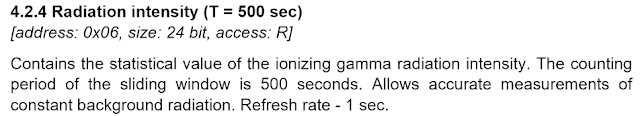
The static sensor readout is more appropriate for measurement of constant background radiation.
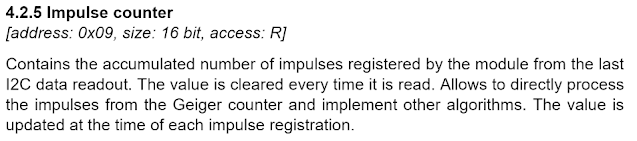
The impulse counter could be used to augment the built in LED that flashes every time an ionizing event occurs. Perhaps some code with a short delay in the main loop that sends a UDP real-time packet to a WLED device to trigger some fancy radiation themed lighting. Maybe I will write about this in a future post!
Also, for additional insight into the data, I have my MQTT broker bridged with AWS IoT Core with a rule to send sensor data to AWS Timestream (which can be visualized with Grafana, which I have running in docker/ECS). I also have a rule that sends the data to a lambda function that formats the data as StatsD format and sends it over to a Graphite-Statsd docker container I have running on an ECS instance.
Timestream + Grafana
Lambda function + Graphite-Statsd


No comments:
Post a Comment